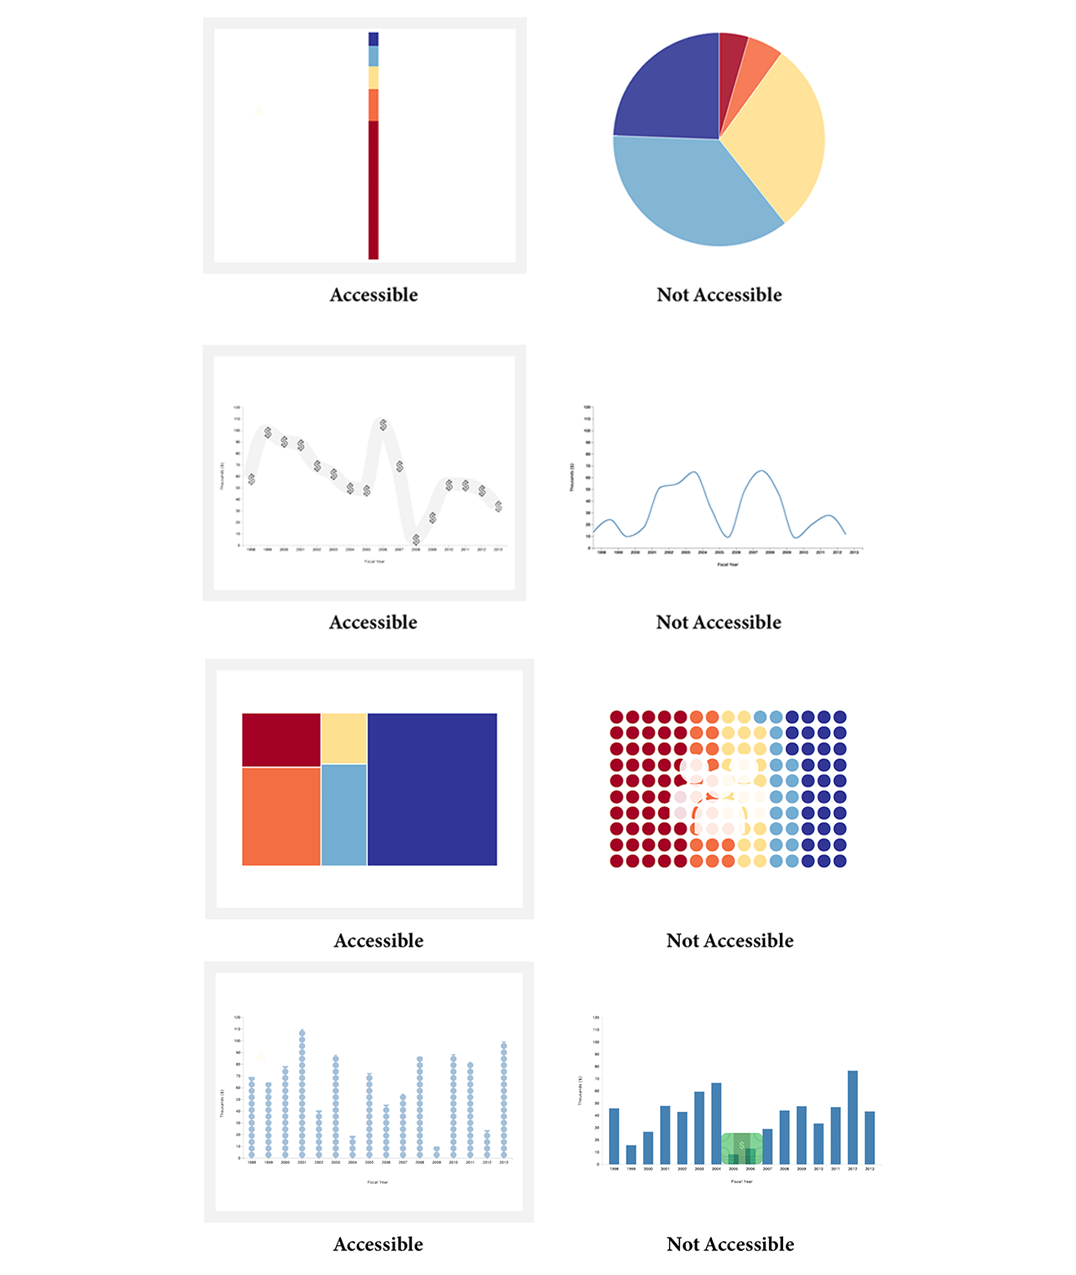
Using visualization requires people to read abstract visual imagery, estimate statistics, and retain information. However, people with Intellectual and Developmental Disabilities (IDDs) often process information diferently, which may complicate connecting abstract visual information to real-world quantities. This population has traditionally been excluded from visualization design, and often has limited access to data related to their well being. We explore how visualizations may better serve this population. We identify three visualization design elements that may improve data accessibility: chart type, chart embellishment, and data continuity. We evaluate these elements with populations both with and without IDDs, measuring accuracy and efciency in a web-based online experiment with time series and proportion data. Our study identifes performance patterns and subjective preferences for people with possible solutions that may break the cognitive barriers caused by conventional design guidelines.
DOWNLOAD PDFOur Findings


